
Excel, SQL, Python or Power BI: What Should You Learn First?

The expensive mistake is not picking the wrong tool. It is picking all four at once and quitting at month three.
Learn Excel first, then SQL, then Power BI, then Python. Take each to a usable standard before moving on: four to six weeks per tool at eight to ten hours a week. This is not the order of employer demand, where SQL leads, but each tool makes the next easier, and trying all four at once is the expensive mistake.
Sequence solves this, and the right sequence is not the same as the order of importance.
The short answer
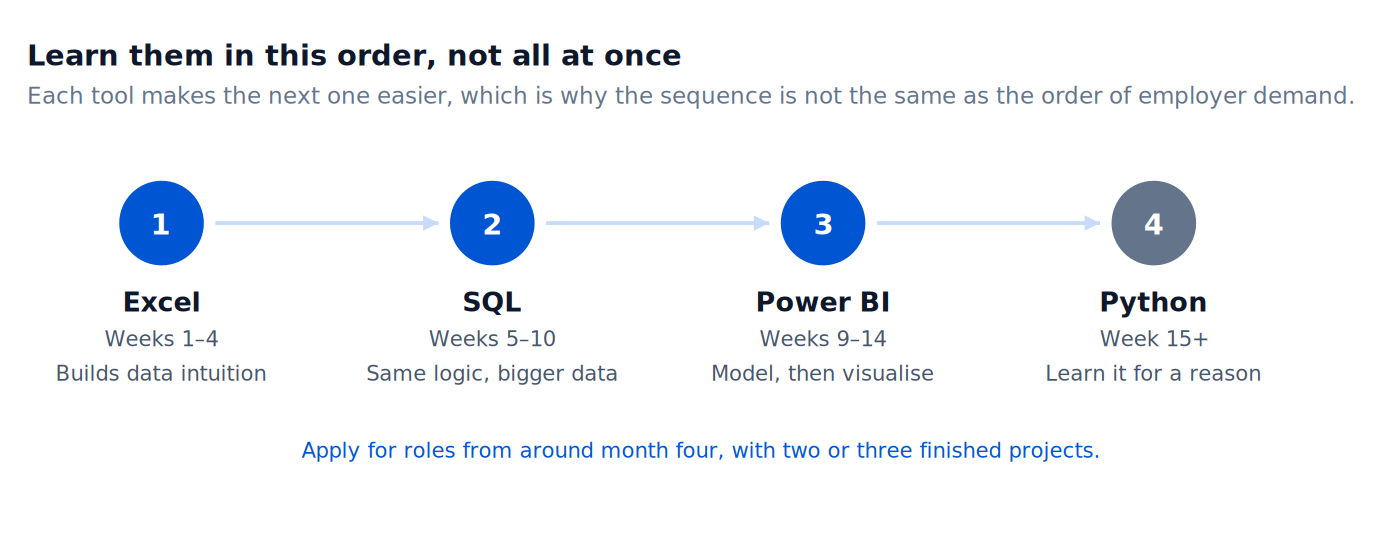
Excel → SQL → Power BI → Python.
Learn each to a genuinely usable standard before moving on. Roughly four to six weeks per tool at eight to ten hours a week, with the last two overlapping.
Note that this is deliberately not the order of employer demand. SQL appears in 56% of UK data analyst adverts against Excel's 44.5%, so on pure demand you would start with SQL. Sequence beats demand ranking because each tool makes the next one easier to learn, and momentum is the scarce resource for self-taught learners.
1. Excel, weeks 1–4
Why first: it is the only one of the four with no setup cost and no syntax barrier. You can see the data. That visibility is exactly what builds intuition about rows, columns, filtering, aggregation and joins before those concepts become abstract.
What to actually learn: pivot tables, XLOOKUP and INDEX/MATCH, IF logic, text and date functions, and Power Query inside Excel for cleaning. Power Query matters more than most beginners realise, because it is the same engine used in Power BI. Learning it here means you get that step free later.
When to move on: when you can take a messy 5,000-row export and produce a clean summary without fighting the tool.
2. SQL, weeks 5–10
Why second: everything you just learned in Excel has a direct SQL equivalent. Filtering becomes WHERE. Pivot tables become GROUP BY. Lookups become JOINs. You are learning new syntax for logic you already have, which is far easier than learning both at once.
What to actually learn: SELECT and WHERE, GROUP BY with aggregates, INNER and LEFT JOIN, ORDER BY, subqueries, CTEs, and then window functions. That final item is where most beginners stop too early and it comes up constantly in real work.
When to move on: when you can answer a business question against a database you have never seen, using two or three joined tables, without a tutorial open.
3. Power BI, weeks 9–14
Why third: Power BI is where SQL and Excel converge, and it is much easier once you understand the data underneath. Learners who start here build pretty dashboards on top of models they do not understand, then hit a wall the moment a number comes out wrong.
What to actually learn: Power Query transformations, star schema data modelling, core DAX (SUM, CALCULATE, time intelligence), and report design that answers one question clearly.
Employer note: Power BI appears in 49.2% of UK analyst adverts, ahead of Tableau at 39.5%, and the Microsoft ecosystem around it (Azure 37.3%) reinforces the lead. In the UK specifically, Power BI is the right first BI tool.
When to move on: when you have published one dashboard you would be comfortable defending in an interview.
4. Python, weeks 15+
Why last: it is the most abstract of the four, and the only one you can be hired without at junior level. Python appears in 45.8% of adverts, which is high, but its absence rarely loses a junior candidate an offer, whereas weak SQL routinely does.
Learning it last also means you learn it for a reason. Once you have hit Excel's ceiling on a large file, or manually rebuilt the same report six times, pandas and scripting suddenly make obvious sense.
What to actually learn: pandas for data manipulation, matplotlib or seaborn for quick visuals, reading and writing files, and basic automation. Skip web frameworks and software engineering patterns.
Where AI fits into all of this
Use AI assistants from day one, but with one rule: never accept output you could not have written yourself, in a tool you have not learned yet.
An AI that writes your SQL while you learn SQL feels like acceleration and is actually substitution. You will pass the exercise and fail the interview. Once you can write the query, using AI to write it faster is straightforwardly good practice, and it is what nearly 40% of UK analyst adverts now expect.
Frequently asked questions
Can I skip Excel if I already use it at work? If you are comfortable with pivot tables and lookups, yes. Spend a week on Power Query specifically, then move to SQL.
Should I learn R instead of Python? For UK analyst roles, no. R appears in 1.6% of adverts against Python's 45.8%. R is worth it only in academia, pharma or specific statistical teams.
How long until I can apply for jobs? Realistically after Power BI, around month four, with two or three finished portfolio projects. Applying earlier tends to produce rejections that damage momentum more than they teach you anything.
Uptrail's AI Data Analyst Bootcamp follows exactly this sequence with live mentor sessions at each transition point, because the moments people give up are almost always the handovers between tools rather than the tools themselves.
Sources: ITJobsWatch, Data Analyst skills co-occurrence data, 6 months to 1 September 2026.
Read next
A curriculum in the right order
Uptrail's Data Career Programme follows this sequence with live drop-in clinics at each transition, because the points people give up are the handovers between tools.
Explore the Data Career ProgrammeBook a free consultation